Rising prices for a wide range of goods and services have been dominating the news – and the concerns of millions of Americans – for the past year or more. From a low rate of 1.36% in December of 2020, the inflation rate for December of 2022 was 6.45%, which was down from a high of 9.06% in June of 2022.1 The primary drivers of inflation have been food, which averaged an increase of 10.4% over the last year, and energy, which averaged 7.4%.2
In contrast, healthcare price inflation increased by a lower 4% in 2022. This is a higher rate than the previous two years, when healthcare inflation rates were 1.8% in 2020 and 2.2% in 2021,3 but still lower than the overall inflation rate.
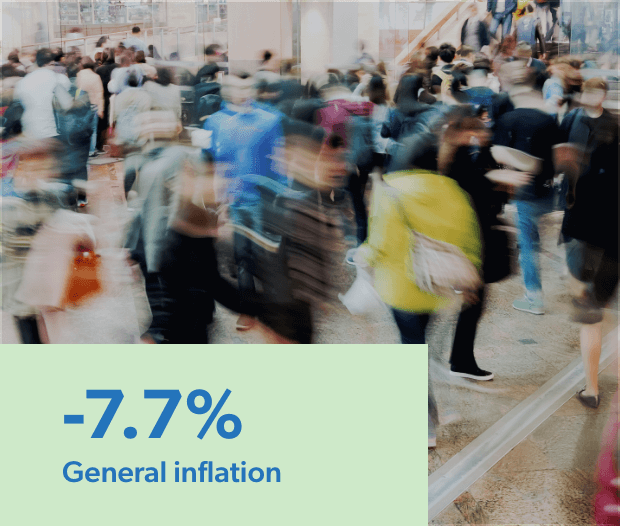
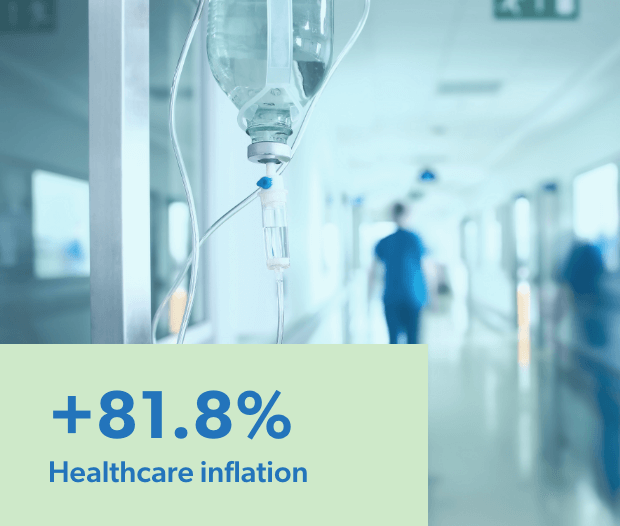
This appears to be good news for medical care costs but, perhaps tellingly, the healthcare inflation rate nearly doubled over the last year, while the general inflation rate decreased by 7.7%.
Changes in Inflation Rate
Dec 2021 – Dec 2022
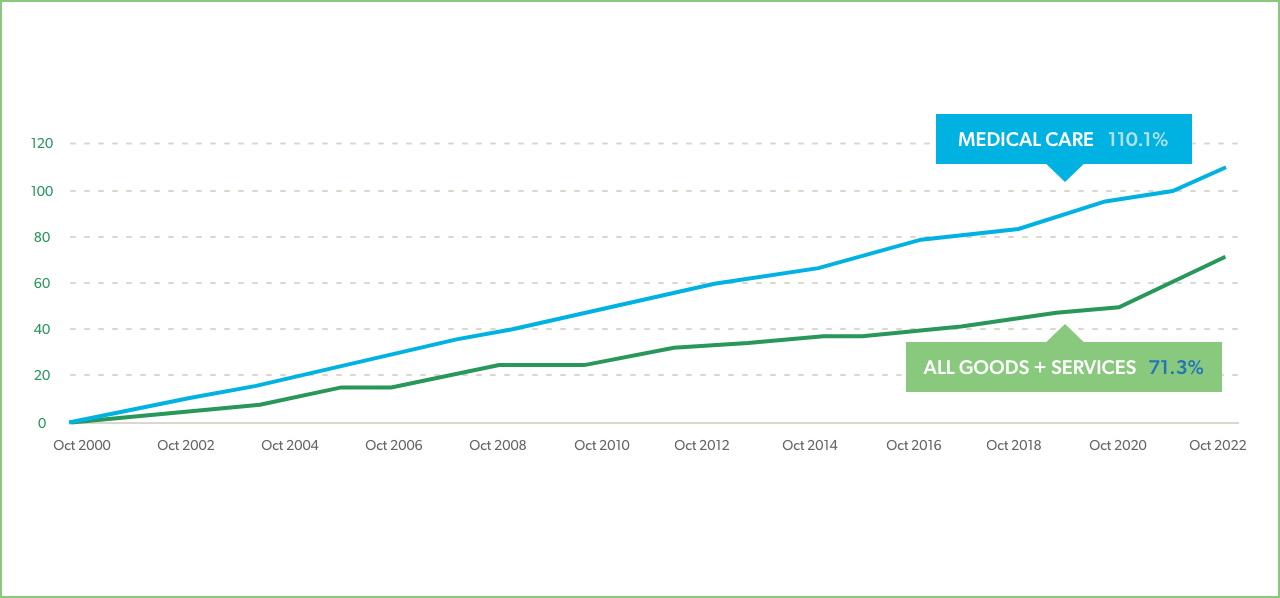
Historically, healthcare prices have increased at a steeper rate than other consumer prices. From 2000 – 2022, the price for all consumer goods and services rose 71%, while the price of medical care rose 110%.4 But healthcare prices are not as volatile as most consumer prices and tend to increase in a more steady fashion, increasing between 1% and 5% each year over the past two decades.
Healthcare cost increases also lag behind general inflation due to multi-year contracts between medical suppliers, providers, and payers. Reimbursement rates may not be impacted for several years due to the payer-provider renewal cycles, which are typically three years. Healthcare supply costs increased by 18% between 2019 and 2022 and hospital labor costs grew by 25%.5 Providers have borne the brunt of these increases to date, but there are signs that higher costs are now being passed on to payers and consumers. For example, a Kaiser Family Foundation survey of the ACA insurance market found that the median proposed premium increase for 2023 was 10% and insurers are anticipating healthcare cost increases of 4% - 8%.6
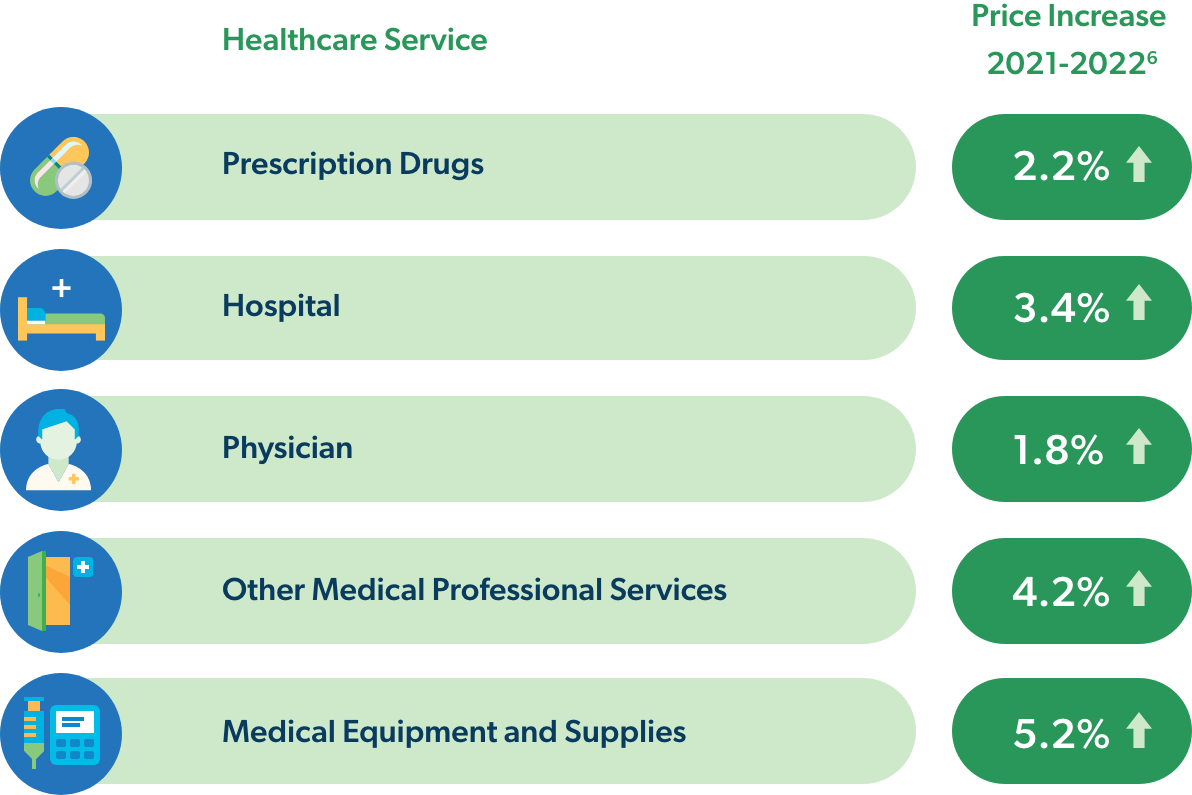
Cost increases for payers in the general healthcare sector may vary considerably, depending on the mix of medical services they use:
Wages for the U.S. labor force have also been increasing at higher than typical rates, averaging 4.5% in 2021 and 5.1% in 2022.7 But these increases have not kept pace with inflation or healthcare costs. Health insurance premiums have increased 20% over the past five years and are likely to rise even more than usual in 2023.8 These cost increases will be an economic burden for many workers, and the workers’ compensation industry may also be adversely affected.
Wage increases for healthcare workers are a significant factor in rising healthcare costs. Since 2021, healthcare worker wages increased faster than average wages, with an average increase of 17% for private healthcare employees, as opposed to 15% for general private sector employees.9 However, wages for positions that do not require academic degrees or licensure, such as home health aides, are still quite low, prompting many of these employees to move to other industries and causing serious labor shortages.10 Those shortages cause short supply at a time when demand is growing, which also causes prices to rise.
When it comes to home health care, the problem is not one of higher wages leading to higher costs. It is a problem of low wages leading to short supply as demand grows.
The economics of workers’ compensation healthcare are different than those of group health, so neither prices nor costs (as a combination of price and utilization) will increase in parallel with the wider healthcare industry. But higher prices for facilities, provider services, prescription drugs, and medical equipment and supplies will inevitably have an impact on costs for workers’ comp payers. Industry leaders appear to be expecting that impact, as indicated by the 58% who cited medical price inflation as a top industry concern for 2023.15
Medical expenses comprise the largest portion of workers’ comp costs and they have increased at relatively modest rates over the past decade. From 2012 to 2019, the annual rate of increase was about 1.5%. In 2021, workers’ comp medical costs rose by 2%.16 Cost increases in 2021 were primarily from facility price increases and physician fees. Other costs, including medical equipment and supplies, also increased. But drug costs decreased, as has been the trend for several years.

Workers’ compensation medical costs are expected to have increased in the range of 3.7% for 2022,10 which is an 85% increase over 2021. Facility costs, which include inpatient and outpatient hospital services, as well as ambulatory surgical centers (ASCs), account for 40% of workers’ comp medical expenses. Facility costs have increased an average of 3.3% since 2012, with more modest growth until 2015 and sharper annual increases since 2016.18 Price inflation, as opposed to utilization, is the primary driver of rising costs for facility services. The higher prices are largely due to an acute shortage of qualified health professionals, which has resulted in historically high wage increases.
Over the past ten years, costs for physician services have increased at an average rate of 1.5% per year, with steeper increases over the past few years.13 Higher prices, rather than increased utilization, are the main reason the physician cost increases as well. It is worth noting, however, that utilization in the types of services has shifted in recent years. In 2012, surgery accounted for the largest portion of physician service costs in workers’ comp. In 2021, physical medicine comprised the largest share of physician service costs, exceeding surgery costs by 12% 19

Prescription drug costs are trending down in workers’ comp, decreasing by an average of 6% each year since 201820 and now accounting for approximately 8% of workers’ comp medical costs.21 From 2017 – 2020, prescription drug payments decreased by an impressive 41%,22 largely due to vast reductions in opioid utilization rates. However, some new trends are developing in worker’s comp pharmacy, including more specialty drug expenditures, private label topicals (PLTs), and an increase in the average wholesale prices for drugs used in workers’ comp after several years of reduction.23
Healthcare price inflation follows general price inflation, usually by 2-3 years. Prices in 2022 did not rise dramatically, but they did rise more than typically and may signal the beginning of an undesirable trend. According to CMS24, we can expect to see:
Exactly how these increases will impact workers’ comp healthcare costs is harder to predict, due to the many variables, including fee schedules and other regulations, rates and types of injuries, services, utilized, and individual program structure. But it is fair to assume that workers’ compensation medical spend will be impacted by this inflationary environment and payers will want to be prepared.
in an Inflationary Environment
Out-of-network activity is a cost driver at any time and a more expensive one when prices are going up. Prices charged by out-of-network providers are likely to be higher, adding unnecessary costs. Even more important, payers do not have visibility into out-of-network activity until after services have been rendered, denying them the opportunity to ensure safe and appropriate treatment. Maximum network participation is the first and most important step to containing costs. And when out-of-network activity does occur, it is essential to have a retrospective program of action to process third-party bills, communicate with patients about network advantages, and convert out-of-network providers where appropriate.
Facility and physician services comprise approximately 60% of workers’ comp medical costs and a combination of pharmacy and ancillary medical products and service make up the remaining 40%. Many workers’ compensation payers rely on one or two ancillary medical service vendors , which is a risky strategy at any time, and even more so in inflationary times. Prices and availability for durable medical equipment (DME), home health services, diagnostics, and more can be quite variable and it is important to have options. This is especially true of home health care, where acute worker shortages are likely to persist and alternatives to help injured workers, such as transitional facility care, telehealth, and family member support should be explored. Ready access to alternative vendors and visibility into comparative pricing is essential to ensuring the best available product/service at the best price.
Evaluating initial prices is usually a straight-forward exercise of identifying the lowest numbers. But pricing methodologies can be complicated, and it is not always clear how prices/charges to payers are derived. A helpful measure is to see how not only prices, but also total costs, compare to peers in the industry. For example, if quoted prices are low but total costs are high, it could be that utilization is unusually high or that there is some variation in the way that prices are calculated and applied.
Costs are never a function of price alone. Appropriate utilization is at least as important in containing costs. Monitoring treatment for a single patient is a challenge in our fragmented healthcare system and managing whole patient populations is impossible without relevant and timely data. Robust analytics that give clear and actionable information in real time are required to guide therapy decisions, make clinical or operational adjustments, and maintain program quality and cost effectiveness.
Treating workers’ compensation patients has become more complex in recent years. Comorbidities, mental health conditions, and other psychosocial issues complicate care and injured worker patient recovery. Clinicians who understand the nuances of workers’ comp are essential to medical program management. Beginning with foundational clinical strategies, such as establishing formularies, to interpreting data and providing guidance on potential risks and opportunities, qualified clinicians can have a big impact on program performance and cost containment. In addition, outreach programs to providers and/or injured worker patients can alter the course of claims for the better through collaboration and counseling.
